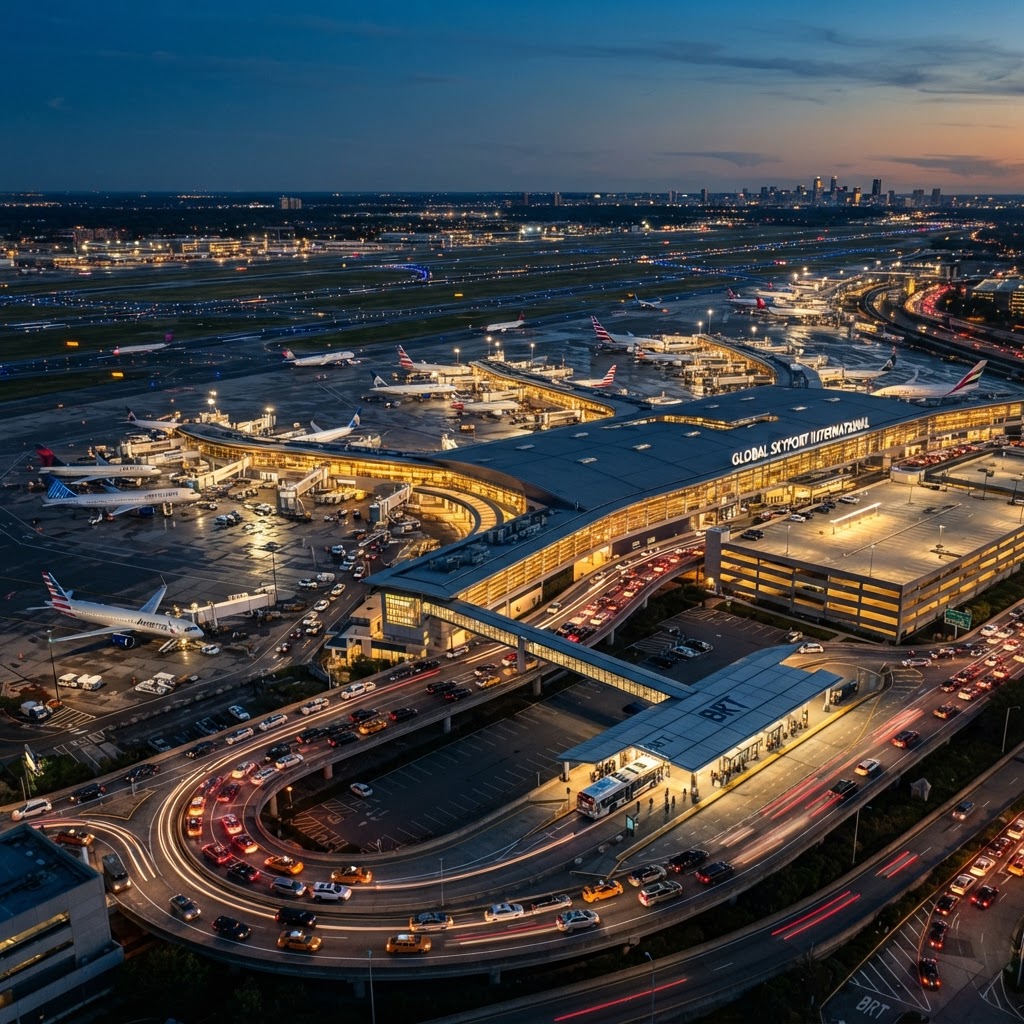
From Terminal Surprise toPredictive Airport Readiness
A predictive readiness layer for flight, baggage, curbside, parking, and transit, shown live on Quotron displays where staff can act on it.
Prepared for Mr. David Ishihara, Deputy Executive Director of Aviation, Operations, Safety and Security, Massport
Executive Summary
Mr. Ishihara, Logan sits at the intersection of flight operations, baggage flow, curbside pickup, parking, and Silver Line transit, all converging on the same terminal footprint every bank of the day. When one system runs behind, that pressure quietly moves into the next one, and today it is usually seen only after it becomes a line, a jam, or a missed connection.
We're proposing a focused pilot to prove out that pressure with real Logan data: how early MovementAI can flag it, and how clearly Quotron's live displays can put that signal in front of the staff standing where the decision gets made.
Pilot Site
Boston Logan International Airport
Logan is a movement-dense hub where flight operations, baggage flow, curbside pickup, parking, and Silver Line transit converge on the same terminal footprint every bank of the day.
Logan becomes the proof site that airport movement can be predicted, not just monitored after the fact.
Annual passengers
~40M/yr
Four terminals (A, B, C, E) handling continuous departure banks, arrival surges, and connections across dozens of carriers.
Baggage movements
50k+ bags/day
One integrated Vanderlande system routes checked bags across all terminals, making a single jam a system-wide risk.
Curbside & parking
6 garages + curbside
Central Parking, terminal garages, cell phone lots, and rideshare staging all compete for the same curb minutes.
Ground transit
Silver Line SL1 + shuttles
Silver Line, on-airport shuttles, water transportation, and Logan Express buses all feed the same terminal curbs.
The Cascade Problem
Every delay at Logan is a chain reaction.
A late inbound flight does not stay contained. It pushes gate turns, backs up baggage, floods the curb, fills the nearest garage, and misses the next Silver Line window, all before anyone in a single control room sees the whole picture.
Baggage cascade risk
A jam at one terminal's baggage system can ripple across the shared Vanderlande network, delaying bags at gates that never caused the problem.
Curbside congestion
Rideshare, taxis, drop-off, and pickup all compete for the same curb minutes during arrival and departure banks, backing up terminal roadways.
Parking mismatch
Central Parking, terminal garages, and cell phone lots fill unevenly across a bank, leaving some structures full while others sit empty.
Ground transit handoff
Silver Line SL1, shuttles, and Logan Express buses arrive on independent schedules that rarely align with the terminal's actual passenger surge.
Security lane pressure
TSA lane demand swings sharply by bank and terminal, and staffing/lane openings often react after the queue has already formed.
Cross-system blindness
Flight ops, baggage, curbside, parking, and transit each run their own systems today, so no single view shows how one delay is about to become five.
Documented Logan Problems
Real, reported problems this pilot is built to address.
These are not hypothetical pain points. Each one below has been reported by passengers, local media, or Massport itself, and each maps directly to a specific MovementAI signal and Quotron display placement in this proposal.
Curbside congestion from unmanaged rideshare pickup
The Boston Globe, "Curb your complaining: Logan's Lyft and Uber drop-off plan will not ruin your life" (2019), and Massport's own Uber/Lyft curbside guidance, both describing recurring curbside congestion driving Massport's dedicated drop-off and fee restructuring at Logan.
Today
Rideshare pickup demand piles onto the same upper-level curb across multiple terminals at once, with no live signal showing which curb or lot still has capacity before drivers and riders are already circling.
After the Building Brain
MovementAI correlates live rideshare staging-lot volume with curb occupancy per terminal, flagging a specific curb or lot approaching saturation minutes ahead. Quotron displays at the cell phone lot and curb show real-time load, so drivers and riders route to the space that is actually open instead of guessing.
Winter storm ground stops and deicing-driven delays
Massport's own airport alerts page and NBC Boston's coverage of winter-storm flight cancellations at Logan, both documenting deicing operations and ground stops that trigger widespread delays with limited advance passenger notice.
Today
Deicing and ground-stop pressure hits the whole terminal at once, with gate turn risk, GSE availability, and ramp readiness tracked in separate systems that do not talk to each other until the backlog is already visible.
After the Building Brain
MovementAI reads GSE and deicing-truck telematics alongside gate and flight data to project which gates and ramps are approaching turnaround risk first. Quotron units at the ramp control desk and terminal ops centers surface that readiness signal before the backlog spreads terminal-wide.
Arrival delays tied to unspecified ground staffing gaps
The Boston Globe, "FAA issues delay advisory at Logan, citing staffing issues" (Nov. 1, 2025), reporting average arrival delays of 33 minutes caused by unspecified staffing shortfalls.
Today
A staffing gap in one operational area shows up to passengers only as an unexplained delay, because there is no shared, real-time view connecting staffing coverage to the specific gates and processes it is slowing down.
After the Building Brain
MovementAI reads staffing coverage against live gate, ramp, and flow data to flag exactly where a coverage gap is becoming a delay risk, before it shows up as an FAA advisory. Quotron units at supervisor and ramp stations surface that gap early enough to redirect available staff.
Security checkpoint wait time spikes by terminal
Massport's own published Security Wait Times page, which tracks estimated wait by checkpoint and terminal and separately notes that overflow beyond the queue entry point can extend waits further.
Today
Massport already publishes per-checkpoint wait times, but that data lives on a public webpage, disconnected from the staffing and lane-opening decisions made in real time on the floor.
After the Building Brain
MovementAI reads the same published checkpoint wait-time signal continuously and flags when a specific checkpoint is trending toward a staffing mismatch. Quotron displays at checkpoint queues and supervisor stations make that trend visible before the line visibly grows.
Cell phone lot and overflow lot underuse
Massport's own Pickup and Drop-Off page, which confirms the Cell Phone Waiting Lot's location and 30-minute limit, cross-referenced with public airport-parking guides noting Massport occasionally opens a separate overflow lot near Terminal E that many drivers are unaware of.
Today
Drivers default to the one cell phone lot they know, overfilling it and triggering the 30-minute enforcement limit, while a second overflow lot sits underused just because no one is told it exists.
After the Building Brain
MovementAI tracks live occupancy across both the primary and overflow cell phone lots, and Quotron signage at the lot entrance and nearby garages routes drivers to whichever lot actually has open space in that moment.
Alignment with Massport's Draft 2025 Strategic Plan
This pilot fits inside Massport's own stated priorities.
Massport's own draft 2025 Strategic Plan, released for public comment in early 2026, names the exact capabilities this pilot would help build out.
Digital/Data & AI is a named pillar
Massport's draft 2025 Strategic Plan lists Digital/Data & AI as one of four organization-wide foundational capabilities, alongside Talent, Community, and Sustainability & Resilience, not a side project.
Remote terminals & transit priority
The Plan calls for enhancing Logan's HOV and transit options, including "innovative ideas like remote terminals." MovementAI's Silver Line and ground-transit sync is a direct, low-cost step toward that same goal.
Terminal core modernization
Logan's terminal core is slated for passenger-experience modernization. Quotron's zone-based readiness displays are a near-term, low-capital way to make that modernization visible now, ahead of larger construction timelines.
Curbside flow named authority-wide
The Plan separately prioritizes curbside flow at Flynn Cruiseport, showing Massport already treats curb management as a strategic metric, not just an aviation-specific concern MovementAI could extend across the portfolio.
Source: Massport, "Massport Releases Draft 2025 Strategic Plan," public comment period through March 6.
MovementAI Role
The intelligence engine.
MovementAI connects approved flight, baggage, curbside, parking, and transit data, learns Logan's bank rhythm, and generates Intervention Cards before pressure becomes visible congestion.
It is the Building Brain: the system that decides what is building up, what is at risk, and what needs to move.
Patent pending, USPTO Provisional Application No. CEECEE-001PROV.
Quotron Role
The physical visibility layer.
Quotron's wireless LED ticker units, placed at ops centers, curbside, garage entrances, and Silver Line platforms, display zone-specific readiness signals: curb load, garage availability, bag-flow exceptions, checkpoint waits, and transit-arrival sync.
The terminal stops being a dashboard people check and starts speaking directly to the people standing where the decision gets made.
Quotron Hardware Summary
What Quotron brings to the terminal.
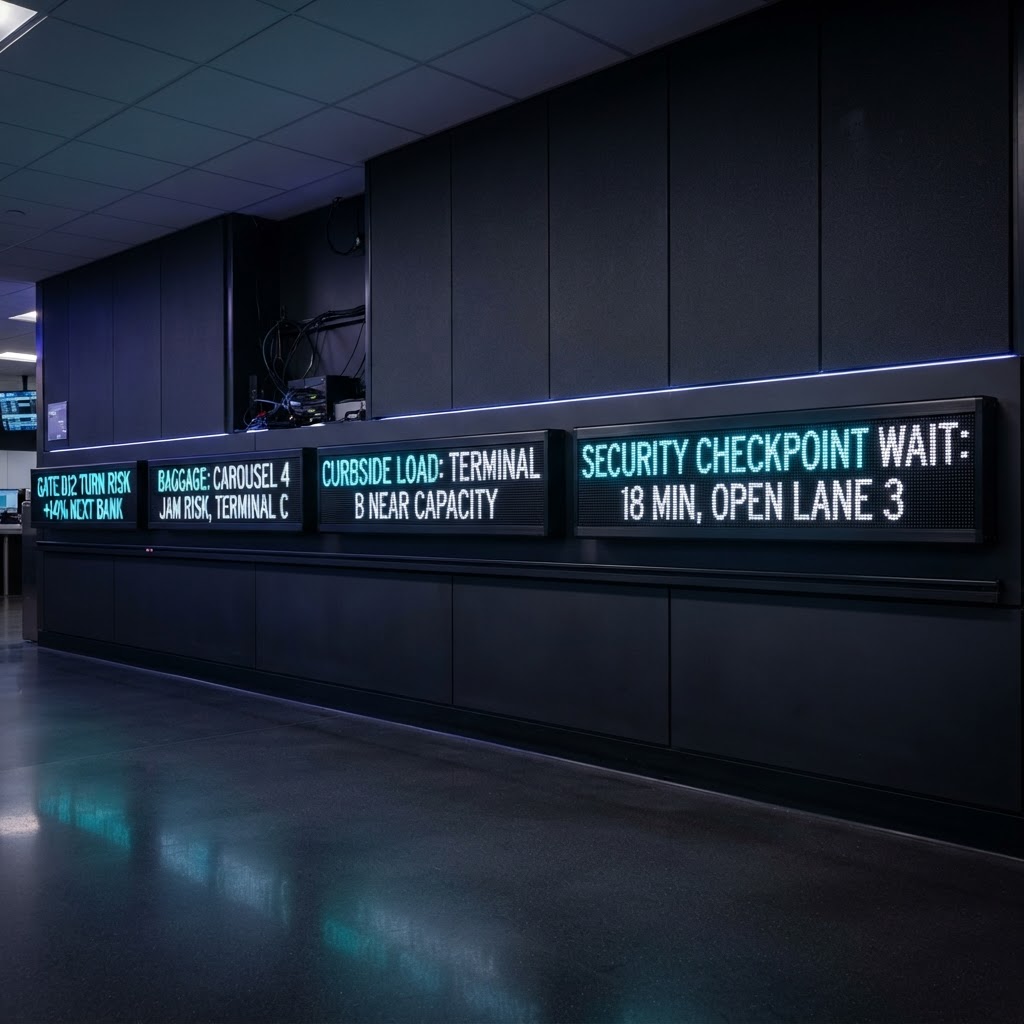
Quotron's Size Range, Applied to Airport Zones
Each Quotron size is shown streaming a different MovementAI signal, gate-turn risk, a bag-jam alert, curbside load, and checkpoint wait time, matching the device to the zone it would serve.
Visualization: custom AI-generated image, not an actual product photo, showing airport-specific data use cases.
Technical Integration Architecture
How a signal becomes a message on a screen.
Five governed stages sit between an approved Massport data source and a live Quotron display, so nothing reaches the terminal floor without passing through readiness scoring and permission checks first.
Stage 1
Signal ingestion
Approved AODB, Vanderlande baggage, curbside/parking sensor, and transit feeds land in MovementAI on a read-only, Massport-revocable connection.
Stage 2
Building Brain processing
Signals are normalized into readiness and cascade-risk scores per zone, patent-pending logic that decides what is building up, what is at risk, and what needs to move.
Stage 3
Content governance
Every outbound message is checked against zone-level permission rules before it is allowed to reach a display, so a curb screen never shows baggage-system detail and vice versa.
Stage 4
Quotron rendering
Cleared messages are pushed to the Wi-Fi connected Wolf and Whale units over Quotron's managed content channel, refreshed on a short interval per zone.
Stage 5
Offline & latency fallback
If a feed drops or a unit loses connection, displays hold the last verified message and flag staleness rather than showing an unverified or blank signal.
What Logan Has Already Installed
MovementAI does not replace these systems, it reads them.
Massport has already invested heavily in the operational backbone this pilot sits on top of. The opportunity is orchestration intelligence across existing systems, not new infrastructure.
Vanderlande baggage handling
A $71.5M integrated baggage system spanning Logan's terminals, the backbone MovementAI would read for bag-flow and exception signals.
JM Electrical building management system
A newly installed BMS gives Logan centralized visibility into building infrastructure, a natural source for facility-side movement and energy data.
Airport Operational Database (AODB)
Logan's central flight, gate, and stand-assignment hub links schedules, turn times, and baggage routing, the richest existing feed for cascade modeling.
Airport Collaborative Decision Making (A-CDM)
If Logan runs A-CDM, MovementAI would read its turnaround and taxi-time predictions as an airside input, then extend that cascade logic into curb, parking, and transit.
FlyLogan app
Massport's own app streams live bus locator GPS, indoor wayfinding, and flight status, a passenger-facing signal source MovementAI can read directly.
Massport Next innovation platform
Massport runs a formal intake program for new operational technology, the direct front door for a MovementAI pilot rather than cold procurement.
Framingham Remote Terminal
Massport's first-in-the-nation remote check-in and security terminal proves Logan will pilot novel movement-orchestration concepts at scale.
Trains, Buses, Curbside & Parking
One readiness picture for every way people reach the terminal.
Passengers reach Logan by transit, rideshare, car, and shuttle, all landing on the same curb minutes apart. MovementAI treats these as one coordinated arrival system, not four unrelated ones.
Silver Line SL1 & shuttles
Silver Line arrival timing and shuttle loops are read as scheduled-capacity signals, so a terminal knows how many transit passengers to expect before the doors open.
Curbside & rideshare
Live curb occupancy plus rideshare staging-lot dwell time flags a specific curb approaching capacity minutes before it visibly backs up.
Parking & cell phone lots
Garage and cell phone lot occupancy are compared in real time so signage can route arriving cars to the structure with actual availability.
Cross-mode balancing
MovementAI correlates transit, curbside, and parking together, so a Silver Line surge and a garage nearing capacity read as one event, not three.
Approved Data Inputs
Plain categories, Massport controls every source.
Flight & gate data
Gate times, taxi and turn windows, and delay codes from the AODB, where approved, to anticipate downstream pressure early.
Baggage system signals
Bag-flow volume, jam alerts, and exception counts from the Vanderlande system, read, not replaced, to flag cascade risk early.
Curbside & parking occupancy
Curb dwell time, rideshare staging-lot volume, and garage occupancy, used to balance arrivals across available capacity.
Ground transit timing
Silver Line SL1 arrival windows and FlyLogan bus GPS, aligned against passenger surge to cut transit-curb bottlenecks.
Security & customs wait times
Logan's published TSA checkpoint and Terminal E customs wait times, read as pressure signals, not screening data.
Content Streams
Each display gets one job, not everything at once.
Ramp & ops readiness
Gate-turn risk, GSE and deicing-truck status, and cascade-risk scoring for ops-center supervisors and ramp control.
Curb & parking load
Curb dwell, rideshare staging-lot volume, and garage/cell-phone-lot occupancy for curbside and garage-entrance displays.
Checkpoint & customs pressure
Published TSA per-checkpoint wait times and CBP arrival wait windows for checkpoint queue and supervisor screens.
Ground transit sync
Silver Line SL1 and FlyLogan bus arrival windows against terminal passenger surge, for transit-platform displays.
Public-safe passenger notices
Plain-language wait estimates, pickup instructions, and service alerts, with no internal operating detail exposed.
Quotron Content Governance
Massport controls what every screen is allowed to say.
Zone-locked permissions
Each Quotron unit is provisioned for one content stream only, so a checkpoint display can never surface curb or baggage detail, and vice versa.
Massport message approval
Designated Massport staff, not MovementAI, hold final sign-off on any new message template before it goes live on a display.
Full message audit trail
Every message pushed to every unit is logged with a timestamp and source signal, so any displayed content can be traced back to its origin.
Public-facing redaction
Passenger-facing zones (lobby, curb, transit platform) automatically receive a redacted, plain-language version, never raw operational detail.
Live Display Zones
Where the Building Brain would speak.
Terminal ops centers
Command tickers
Gate turn risk +12% next bank
Baggage claim & ramp
Exception alerts
Bag jam risk: Terminal C carousel 4
Curbside & drop-off
Live curb load
Terminal B curb: near capacity
Garage entrances
Availability routing
Central Parking: 340 spaces open
Silver Line platform
Transit-arrival sync
SL1 arrival: 6 min, 40 passengers
Quotron Physical Placement
Everywhere a Quotron unit could go at Logan, and what it would do there.
Quotron builds compact, wireless, high-resolution LED ticker units for live custom data feeds. At Logan, each unit is a physical extension of the Building Brain: MovementAI decides what matters, and Quotron makes it visible where a person is standing when they need to act. Mr. Ishihara would determine how many units go where, based on where operating pressure is highest.
Terminal ops centers (A, B, C, E)
A Quotron ticker at each ops desk streams live gate-turn risk, cascade alerts, and dispatch countdowns, so duty managers see the terminal's pressure without switching screens.
Baggage claim & ramp offices
Units near baggage offices and ramp stations show bag-jam risk and carousel exceptions the moment the Vanderlande system flags them, ahead of a visible pile-up.
Curbside drop-off & pickup
Weatherized units at curb islands show live curb-load and rideshare staging status, helping attendants redirect vehicles before a lane backs up.
Garage entrances & cell phone lot
Units at Central Parking, garage entries, and the cell phone lot display real-time space availability, so drivers see where to go before committing to a full structure.
Silver Line platform & shuttle stops
Displays at the SL1 platform and shuttle stops show next-arrival timing alongside curb conditions, so riders know what to expect the moment they step off.
Security checkpoint queues
Units near checkpoint queues show live wait times, giving passengers an honest read on which line moves and staff a cue to open another lane.
Passenger-facing lobby & gate areas
Customer-safe units in lobbies and gate holds show flight status, wait times, and service notices, the same data Massport already publishes, just visible without an app.
Ramp & winter operations command
Units at the ramp control desk display GSE and deicing-truck readiness, giving supervisors an at-a-glance view of turnaround risk during storms.
What Each Screen Would Actually Say
Sample readiness copy, by zone.
Ops Center
Curbside, Terminal B
Garage Entrance
Checkpoint Queue, Terminal E
Silver Line Platform
Command Preview
The dashboard becomes the airport's shared readiness picture.
Curbside Load, Today
Live Intervention Signals
Governance & Boundaries
Built to fit inside Massport's existing oversight, not around it.
No FAA or TSA operational authority
MovementAI never issues air-traffic, security-screening, or safety-of-flight instructions. It surfaces readiness signals for Massport staff to act on.
Aggregate, not individual, tracking
Curbside, parking, and transit signals are read as facility-level counts and occupancy, never tied to an individual traveler's identity or itinerary.
Massport controls every data source
Every feed, whether flight data, baggage signals, or curb sensors, is explicitly approved and can be revoked by Massport at any time.
Phased scope, reviewed before expansion
The pilot starts in one terminal or one movement category and expands only after Massport reviews results, matching how Massport Next already evaluates new technology.
White Paper Deliverable
What Mr. Ishihara receives at the end of discovery.
Phase 3 of the pilot roadmap produces a written white paper, not just a demo. It documents exactly what MovementAI found in Logan's approved data and exactly where the first live Quotron zones should go.
Cascade risk map
Where flight, baggage, curbside, parking, and transit pressure concentrate across a live bank, ranked by frequency and severity.
Recommended display zones
The specific ops-center, curbside, garage, checkpoint, and transit locations where a Quotron unit would return the most readiness value first.
Projected impact range
Estimated improvement to curb dwell, gate-turn risk, and transit-curb handoff, benchmarked against the industry data in this proposal.
What Massport Provides
A short, specific list, nothing open-ended.
Approved data access
Read-only credentials or exports for AODB, Vanderlande baggage signals, curb/parking sensors, and published TSA/CBP wait times, scoped by Massport's Digital Technologies Integration Group.
Facility & network access
Badge access for a short discovery walk-through of ops centers, curbside, garages, and platform locations, plus network permission to place Quotron units where approved.
An executive sponsor
A named Massport contact, David Ishihara or a designee, authorized to approve display zones and sign off on the Phase 3 white paper recommendations.
A review checkpoint
One scheduled check-in at the end of each roadmap phase, matching how Massport Next already evaluates new technology before expansion.
Pilot Roadmap
An 8-week path from data to a live readiness signal.
Phase 1, Weeks 1–2
Discovery & data mapping
Confirm approved data sources across flight ops, baggage, curbside, parking, and transit with Massport's Digital Technologies Integration Group.
Phase 2, Weeks 3–5
Movement analysis
MovementAI ingests approved historical and live data to model cascade risk across one terminal's baggage, curb, and transit flow.
Phase 3, Weeks 6–7
White paper & zone plan
Deliver findings on where cascade risk concentrates and recommend the first live display zones, curbside, garage entrance, or ops center.
Phase 4, Week 8+
Live pilot activation
Activate readiness signals in the agreed zones and measure impact on curb dwell time, gate-turn risk, and transit-to-curb handoff.
Pilot Success Metrics
What proves the pilot worked.
Curb dwell time
Reduction in average time vehicles occupy terminal curb during peak arrival banks.
Bag-jam early warning
Minutes of advance notice before a baggage exception becomes a visible carousel delay.
Garage fill balance
Reduction in structures reaching capacity while nearby garages remain underused.
Transit-to-curb handoff
Improvement in curb readiness ahead of scheduled Silver Line and shuttle arrivals.
Industry Benchmarks, Not Guarantees
What predictive readiness is worth elsewhere in aviation.
These figures are published industry research, not Logan-specific projections. They establish the scale of value a cascade-readiness layer can unlock once Massport's own pilot data is measured.
Aircraft block time cost, per minute
2025 U.S. passenger carrier average, $98.41 total per minute (Airlines for America)
Curbside guidance-signage impact
Range of measured gains from variable message parking/curb guidance studies, % improvement (Diaz-Gutierrez et al., 2025)
$33B
Estimated annual U.S. flight-delay cost across airlines, passengers, and the broader economy (FAA/NEXTOR, 2019).
~$1.3M
Annual benefit per aircraft line from a 3-minute turnaround delay reduction using real-time ground-ops alerts (INTACT system study, Aerospace, 2025).
~1 hr
Queue duration reduction observed from variable message parking-guidance signage at studied airports (Diaz-Gutierrez et al., 2025).
Final Recommendation
Make Logan the first proof that an airport can move from reactive to predictive.
Logan already has the infrastructure this pilot builds on: the Vanderlande baggage system, a new building management system, and an innovation intake process in Massport Next.
The path is low-friction: approved data first, MovementAI analysis second, Quotron readiness displays in as many zones as Mr. Ishihara determines are needed third.
A successful pilot, alongside Ms. Sharon Williams and CEO Rich Davey's aviation leadership, gives Massport a repeatable model for managing cascade risk with one visible Building Brain.
MovementAI's Building Brain architecture is patent pending, USPTO Provisional Application No. CEECEE-001PROV.
Prepare the Logan pilot conversationRecommended intake path
Massport Next innovation platform, with direct briefing to David Ishihara (Deputy Executive Director of Aviation) and Mark Ricketson (Deputy Director, Digital Technologies Integration Group).